Why Bitcoin Is Actually Falling
Everyone's searching for emotional narratives or technical patterns to explain Bitcoin's recent drop. They're drawing trendlines, analyzing sentiment, building elaborate theories about market psychology. They're looking in the wrong place.
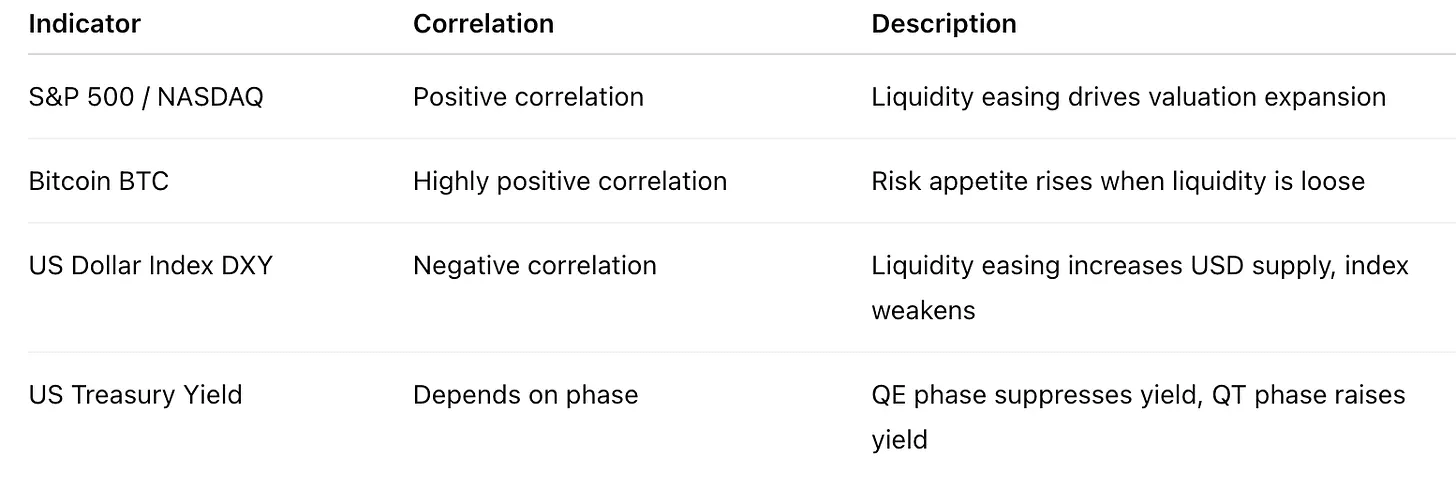
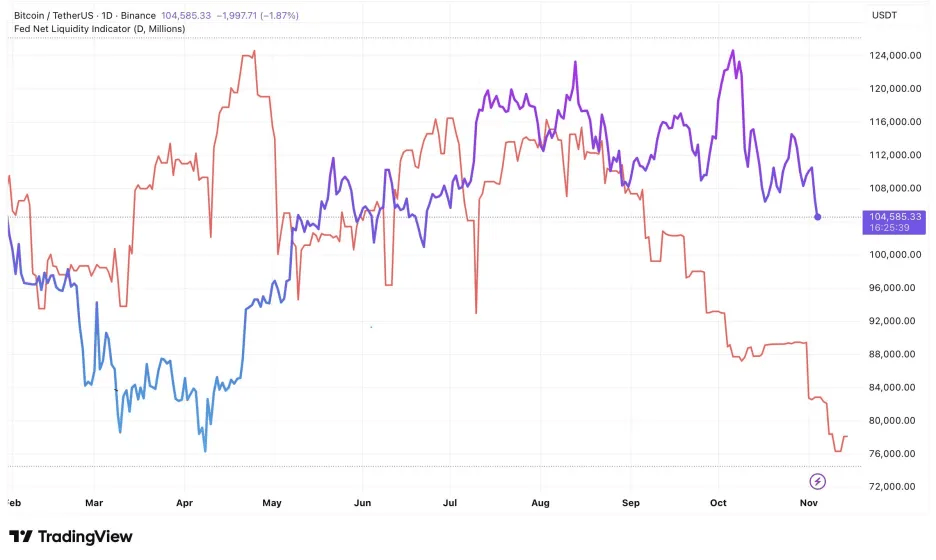
The real answer is sitting right there in the US financial system's plumbing, written into the ledger of dollar liquidity itself. What we're seeing is a structural tightening of US dollar liquidity, and Bitcoin, being the most liquidity sensitive asset in existence, is simply reflecting what the data has been screaming for weeks.
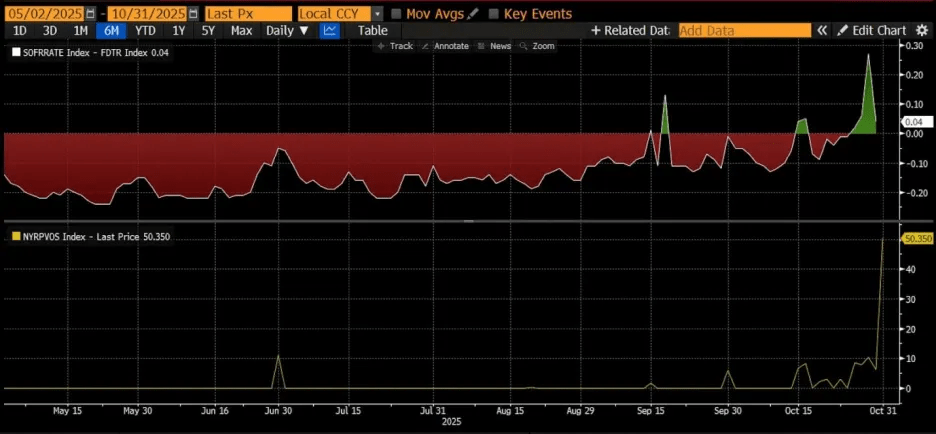
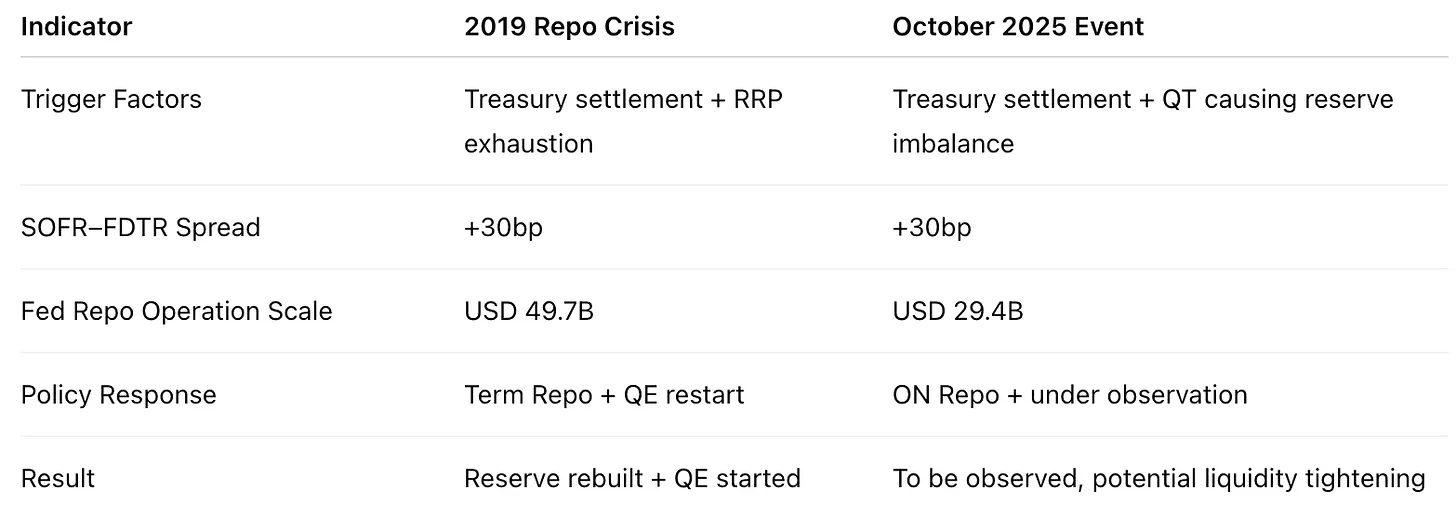
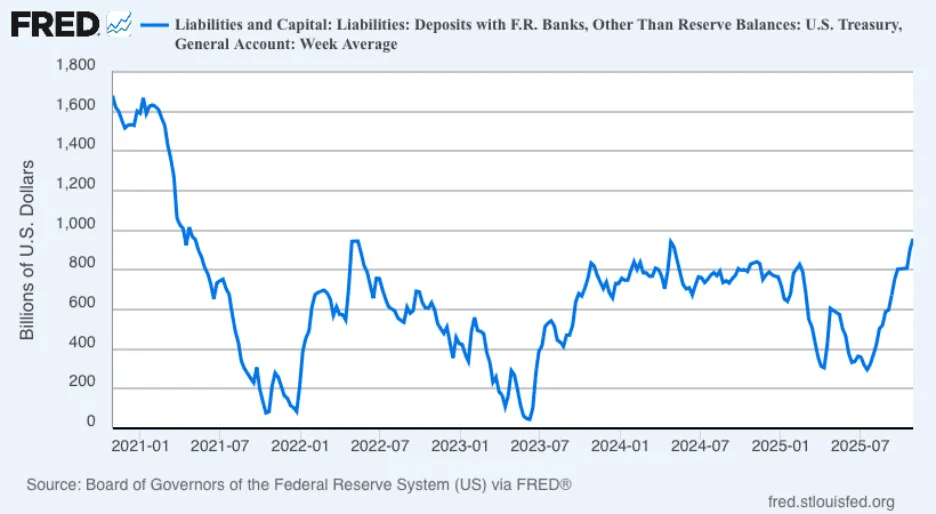
The Treasury General Account balance is approaching $1 trillion. That number represents cash being systematically drained from the market, locked away in the government's account at the Fed. Meanwhile, short term funding markets are showing unmistakable signs of stress. The spread between the Secured Overnight Financing Rate and the Federal Funds Target Rate has widened to positive 30 basis points. When interbank funding costs exceed the Fed's upper policy rate, you're not looking at a technical glitch. You're looking at genuine liquidity strain.
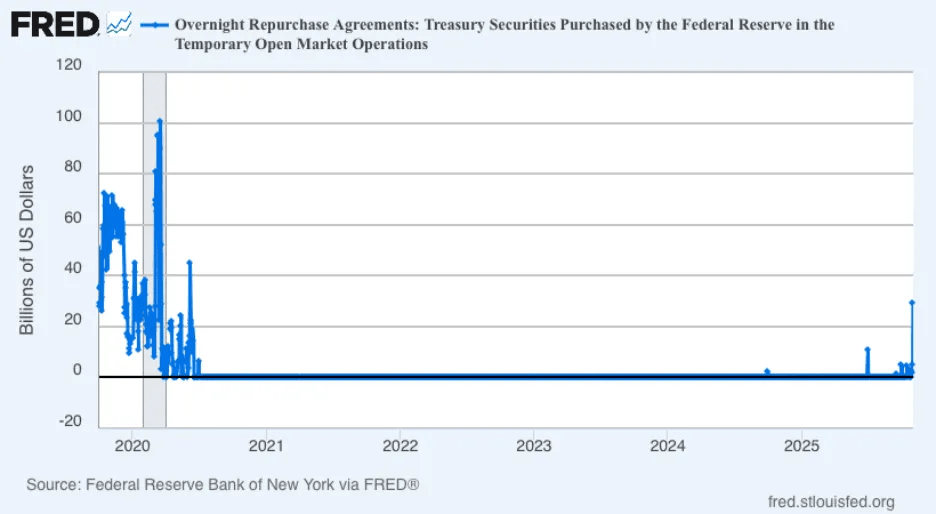
The Federal Reserve knows it too. They just restarted temporary overnight repo operations for the first time since the 2019 repo crisis, injecting nearly $30 billion in liquidity. That's not a routine operation. That's the Fed acknowledging that the plumbing is broken and needs immediate attention.
The Catalyst
The catalyst is the US government shutdown. Facing a budget standoff and shutdown risk, the Treasury has been pre-funding aggressively, issuing massive amounts of debt to build a cash buffer. That cash gets locked into the TGA account, which directly reduces bank reserves. Every dollar sitting in the TGA is a dollar that's not circulating through the financial system. Fewer dollars in circulation means risk assets come under pressure, and Bitcoin, with no yield and no fundamental cash flows to anchor its value, becomes purely a function of available liquidity. When liquidity contracts, Bitcoin contracts with it.
The Liquidity Equation
The mechanism is straightforward once you understand it. Dollar liquidity equals bank reserves plus cash in circulation, which equals the Fed balance sheet minus overnight reverse repos minus the Treasury TGA. This equation captures the available dollar liquidity within the entire financial system. The Fed controls the supply side. The TGA and overnight reverse repos control the absorption side. When the TGA rises, the government is actively draining liquidity from markets. When overnight reverse repos rise, money market funds are parking cash at the Fed instead of deploying it into risk assets. Both are liquidity sinks.
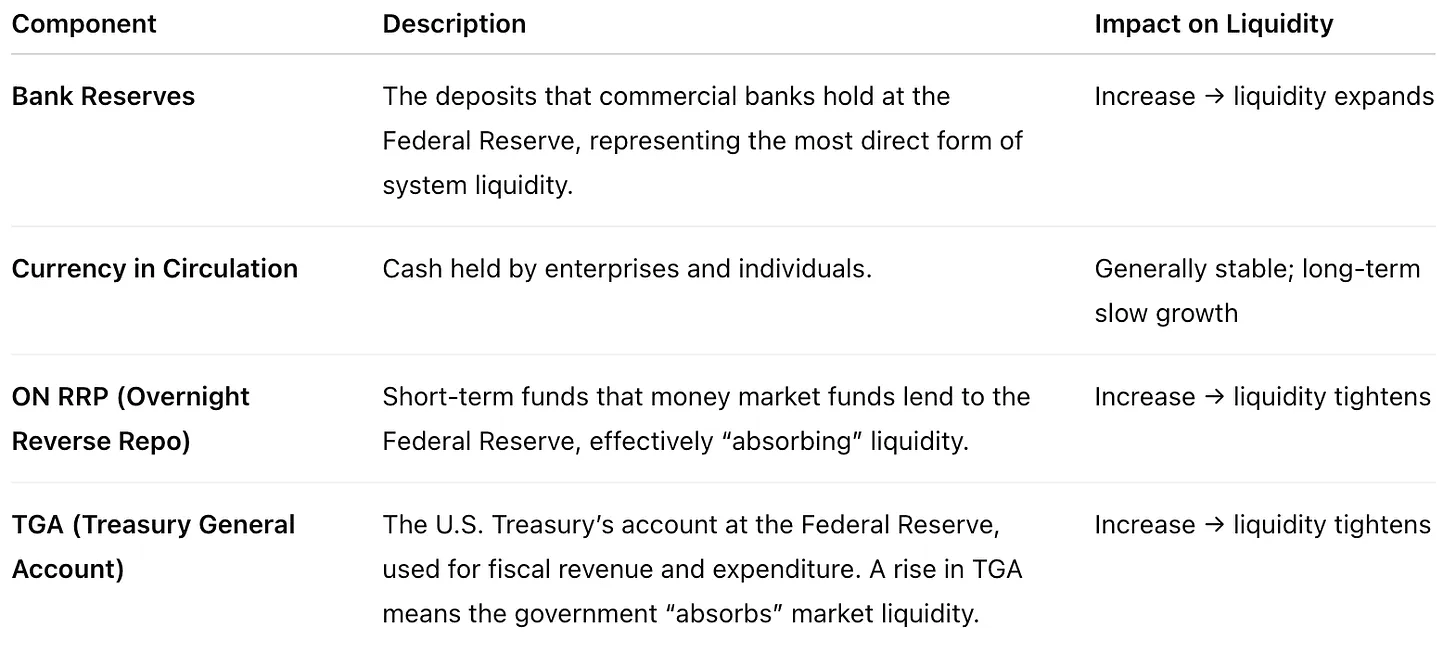
When the Fed balance sheet expands, it increases reserves and cash, so liquidity rises. This is what happened during QE periods. When TGA increases, the Treasury issues debt and absorbs cash, so liquidity falls. When overnight reverse repos increase, money market funds park cash at the Fed instead of deploying it into risk assets, so liquidity falls. Therefore, liquidity goes up when Fed assets increase, TGA decreases, or reverse repos decrease.
Right now, both sinks are active. The TGA is near $1 trillion. The Reverse Repo balance rebounded to $50.3 billion as institutions scramble for collateralized liquidity from the Fed. Bank reserve buffers are being depleted rapidly. Rising interbank lending rates confirm that liquidity pressure isn't theoretical or distant. It's happening in real time, and it's forcing the Fed to intervene.
The Pattern
Yet every time the Treasury hoards cash and liquidity tightens to an extreme, you see the same pattern play out. The market bottoms before the crisis resolves, not after. The reversal comes when conditions look worst, when everyone's convinced things can only get worse.
As of November 5, the government shutdown had reached a record duration. The fiscal, economic, and social pressures are compounding. SNAP food assistance programs are constrained. Airport security and federal air traffic control are facing temporary suspensions. Consumer and business confidence are deteriorating. The stock market pullback is adding political pressure to resolve this quickly. Signs of bipartisan compromise are emerging, which tells you the breaking point is near.
Market expectations now point to the Senate pushing through a compromise before the Thanksgiving recess on November 15. Once the government reopens, Treasury spending resumes immediately. The TGA balance begins declining. Liquidity that was locked away floods back into the system. Bank reserves rebuild. Risk appetite returns. Bitcoin, having been the first asset to fall when liquidity contracted, becomes the first asset to rally when liquidity expands again.
Historical Precedent
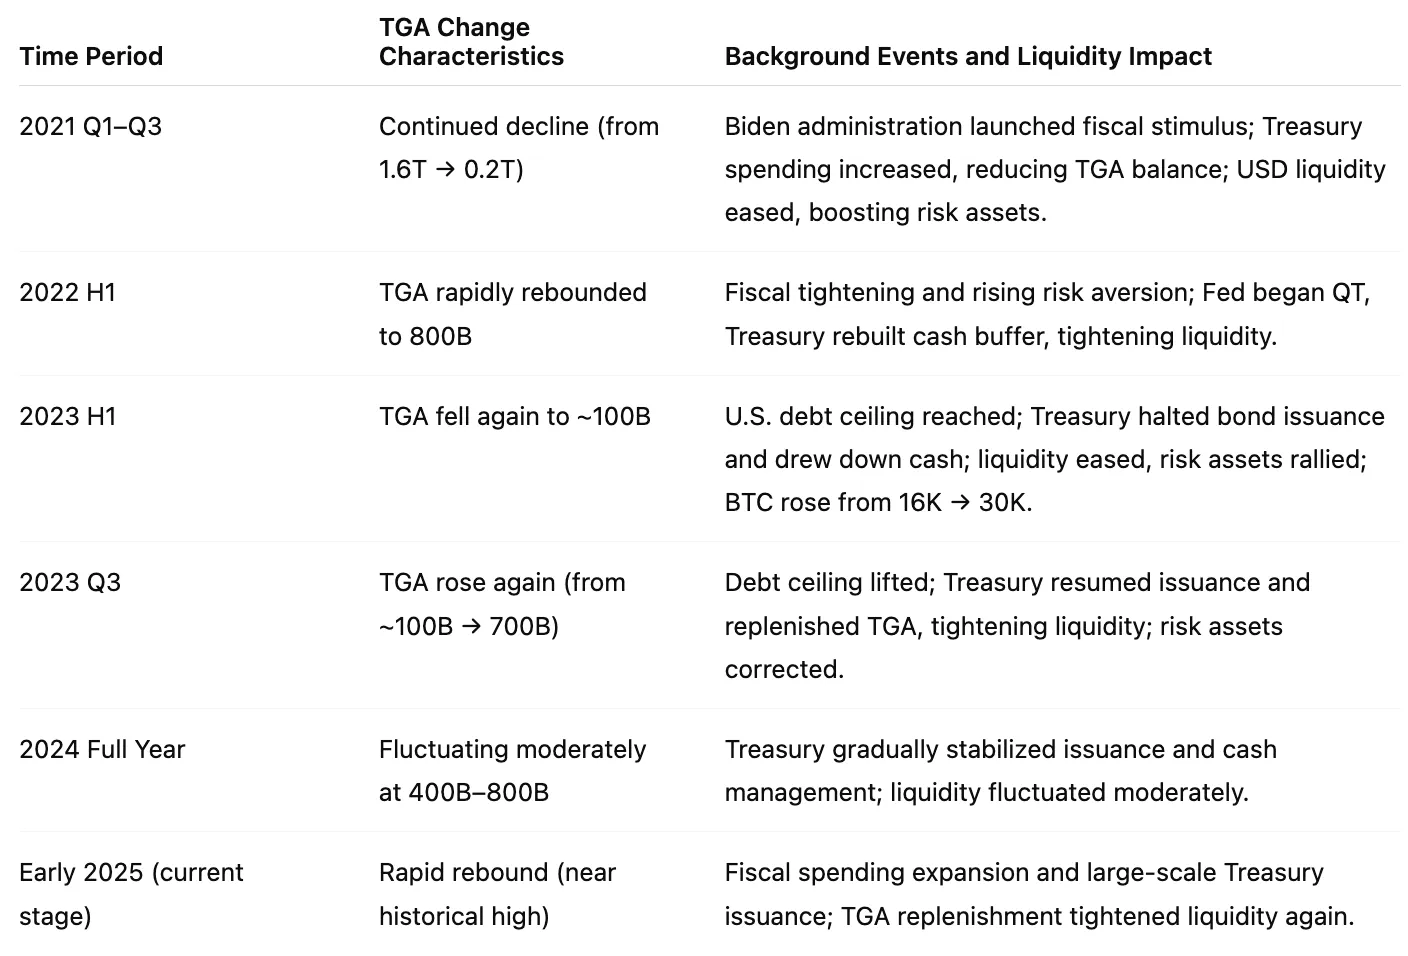
The historical pattern is remarkably consistent. Look at the second half of 2023. After the debt ceiling suspension, TGA replenishment caused short term tightening that led to volatility in equities and crypto. Then in early 2024, the rapid decline in overnight reverse repos returned funds to banks, boosting reserves and igniting risk appetite. The same mechanical process that creates the drawdown creates the recovery.
The Fed's Signal
The Fed's overnight repo operations are already signaling the shift. As of October 31, 2025, overnight repos stood at $29.4 billion, compared with a $49.75 billion peak during September 2019. These operations use Treasuries as collateral to provide overnight cash to primary dealers, functioning as a direct liquidity injection. The magnitude is smaller than 2019, but the symbolic weight is enormous. It signals that liquidity gaps have breached the Fed's tolerance threshold. If these operations continue or expand, you're looking at a de facto policy pivot from passive balance sheet reduction to active liquidity management.
The operation temporarily compresses SOFR to repo spreads, easing funding pressure. If sustained, it creates what amounts to a mini quantitative easing effect, injecting fresh reserves into the banking system even as the official QT program continues. The Fed is telling you through their actions that they see the problem and they're moving to fix it.
Distribution Matters
While broad money supply measured by M2 still appears ample on the surface, the distribution matters more than the aggregate. Bank reserve buffers are what enable financial institutions to provide liquidity to markets. When those buffers shrink, interbank lending rates spike, funding markets seize up, and risk assets collapse regardless of how much M2 exists in the system. The money isn't where it needs to be.
The TGA acts as the inverse indicator of market liquidity. When TGA climbs, market liquidity tightens. When it falls, liquidity eases. Before government shutdowns, the Treasury increases TGA as a precaution, draining liquidity from markets. During shutdowns, spending pauses and debt issuance slows, keeping TGA steady while demand shifts to overnight reverse repos, creating structural mismatches between where cash is and where markets need it. After reopening, Treasury resumes spending, TGA drops rapidly, and liquidity floods back into the system, often driving sharp rebounds in Bitcoin and equities.
Where This Goes
We've seen this movie before. The 2023 debt ceiling deal triggered exactly this sequence. The difference now is that Bitcoin is far more established, far more liquid, and far more integrated into institutional portfolios than it was during previous liquidity cycles. The reaction function should be faster and more pronounced.
Prediction markets and institutions like Goldman Sachs expect the government to reopen between November 10 and 15. Bitcoin may be undergoing its final leg down before the liquidity rebound begins. The confluence of renewed fiscal spending and the next Fed rate cutting cycle marks the beginning of a new liquidity phase. The exact timing remains uncertain, but the direction is increasingly clear.
What looks like Bitcoin weakness is actually Bitcoin accurately pricing dollar liquidity conditions. The asset is working exactly as it should, reflecting the tightening that's happening beneath the surface of broader markets. When liquidity returns, and it will return, Bitcoin will be the first to know.